Interactive jobs
Videos
Videos of this topic may be available from one of our kickstart course playlists: 2025 summer, 2025 winter, 2024, 2023, 2022 Summer, 2022 February, 2021 Summer, 2021 February. Or see computing explained with HPC kitchen.
Abstract
Interactive jobs allow you to quickly test code (before scaling up) or getting more resources for manual analysis.
More importantly, you can request resources via the options you can find in the Triton quick reference.
To run a single command interactively
srun [SLURM OPTIONS] COMMAND ...to run before any COMMAND to run it in Slurm
To get an interactive shell
srun [SLURM OPTIONS] --pty bash(general Slurm)sinteractive(Triton specific)
The exact commands often varies among clusters, check your docs.
Interactive jobs let you control a small amount of resources for development work.
Why interactive jobs?
There are two ways you can submit your jobs to Slurm queue system:
either interactively using srun or by submitting a script
using sbatch. This tutorial walks you through running your jobs
interactively, and the next tutorial on serial jobs
will go through serial jobs.
Some people say “the cluster is for batch computing”, but really it is to help you get your work done. Interactive jobs let you:
Run a single job in the Slurm job allocation to test parameters and make sure it works (which is easier than constantly modifying batch scripts).
Get a large amount of resources for some manual data analysis.
Interactive jobs
Let’s say you want to run the following command:
$ python3 slurm/pi.py 10000
You can submit this program to Triton using srun. All input/output still goes to your terminal
(but note that graphical applications don’t work this way - see
below):
srun --mem=100M --time=00:10:00 python3 slurm/pi.py 10000
srun: slurm_job_submit: Automatically setting partition to: batch-hsw,batch-bdw,batch-csl,batch-skl,batch-milan
srun: job 462418 queued and waiting for resources
Here, we are asking for 100 megabytes of memory (--mem=100M) for a
duration of ten minutes (--time=00:10:00) (See the quick
reference or below for more options).
While your job - with jobid 462418 - is waiting to be allocated resources, your shell
blocks.
In other HPC systems you might need to specify account via --account=ACCOUNT_NAME or
partition --partition=PARTITION_NAME when submitting a job. In Triton a parser
script will give sensible defaults for these based on your job’s requirements, so in most
cases you do not need to use them.
You can open a new shell (ssh again) on the cluster and run the command
squeue -u $USER or slurm q to see all the jobs
you currently have waiting in queue:
$ slurm q
JOBID              PARTITION NAME                  TIME       START_TIME    STATE NODELIST(REASON)
462418             batch-hsw python3               0:00              N/A  PENDING (None)
You can see information such as the state, which partition the requested node reside in, etc.
Once resources are allocated to your job you will see output to your terminal:
srun: job 462418 has been allocated resources
Calculating pi via 10000 stochastic trials
{"pi_estimate": 3.126, "iterations": 10000, "successes": 7815}
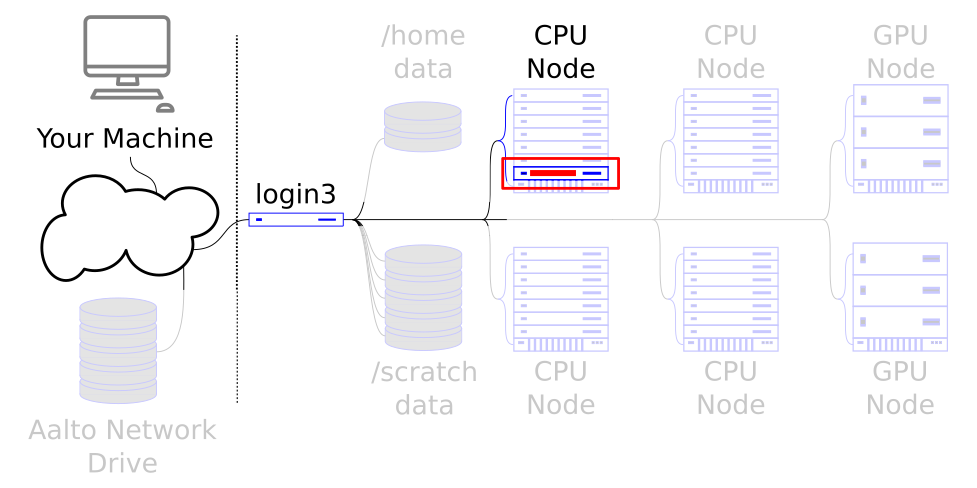
To show it’s running on a diferent computer, you can srun
hostname (in this case, it runs on pe84):
$ hostname
login4.triton.aalto.fi
$ srun hostname
srun: slurm_job_submit: Automatically setting partition to: batch-hsw,batch-bdw,batch-csl,batch-skl,batch-milan
srun: job 462453 queued and waiting for resources
srun: job 462453 has been allocated resources
pe84.int.triton.aalto.fi
Disadvantages
Interactive jobs are useful for debugging purposes, to test your setup and configurations before you put your tasks in a batch script for later execution.
The major disadvantages include:
It blocks your shell until it finishes
If your connection to the cluster gets interrupted, you lose the job and its output.
Keep in mind that you shouldn’t open 20 shells to run 20 srun jobs at once.
Please have a look at the next tutorial about serial jobs.
Interactive shell
What if you want an actual shell to do things interactively?
Put more precisely, you want access to a node in the cluster
through an interactive bash shell, with many resources available, that
will let you run commands such as Python and let do some basic work.
For this, you just need srun’s --pty option coupled with the shell
you want:
$ srun -p interactive --time=2:00:00 --mem=600M --pty bash
The command prompt will appear when the job starts.
And you will have a bash shell runnnig on one of the
computation nodes with at least 600 Megabytes of memory,
for a duration of 2 hours, where you can run your programs in.
The option -p interactive requests a node in the interactive
partition (group of nodes) which is dedicated to interactive usage
(more on this later).
Warning
Remember to exit the shell when you are done! The shell will be running if you don’t and it will count towards your usage. This wastes resources and effectively means your priority will degrade in the future.
Interactive shell with graphics
sinteractive is very similar to srun, but more clever and thus
allows you to do X forwarding. It starts a screen session on the node,
then sshes to there and connects to the shell:
$ sinteractive --time=1:00:00 --mem=1000M
Warning
Just like with srun --pty bash, remember to exit the shell.
Since there is a separate screen session running, just closing the terminal isn’t enough.
Exit all shells in the screen session on the node (C-d or exit) or cancel
the job.
Use remote desktop if off campus
If you are off-campus, you might want to use https://vdi.aalto.fi as a
virtual desktop to connect to Triton to run graphical programs: ssh
from there to Triton with ssh -XY. Graphical programs run very
slowly when sent across the general Internet.
Checking your jobs
When your jobs enter the queue, you need to be able to get information on how much time, memory, etc. your jobs are using in order to know what requirements to ask for. We’ll see this later in Monitoring job progress and job efficiency.
The command slurm history (or sacct --long | less) gives you
information such as the actual memory used by your recent jobs, total
CPU time, etc. You will learn more about these commands later on.
As shown in a previous example, the command slurm queue (or
squeue -u $USER) will tell you the currently running processes,
which is a good way to make sure you have stopped everything.
Exercises
The scripts you need for the following exercises can be found in our
hpc-examples, which
we discussed in Using the cluster from a command line (section
Copy your code to the cluster).
You can clone the repository by running
git clone https://github.com/AaltoSciComp/hpc-examples.git. Doing this
creates you a local copy of the repository in your current working
directory. This repository will be used for most of the tutorial exercises.
Part of a series: ngrams:
Interactive-2: Compute ngrams via batch jobs
Let’s compute some ngrams. This uses the code from the hpc-examples repository AND the data we have transferred, even though they are in two different directories. We want to go to the code directory and point it to the data directory
This and following examples use the data that is already downloaded
to the cluster, stored under
/scratch/shareddata/teaching/gutenberg-fiction/ (so that the
examples will just work, without having to do previous steps). You
can also give it the path to the copy of the data you downloaded.
Some things about this code: If you run with --words, it
computes word-ngrams ([“the”, “lake”]). Otherwise, it computes
character ngrams ([“t”, “h”]). The option -n specifies the n
in ngrams (like -n 2; the default is 1-gram which is simple
character/word frequencies). The -o option says where an
output file should be saved, otherwise it prints it to the screen.
The --help option tells you more or check the code on Github.
First, we try running on the login node. This is just a quick test
to make sure that nothing is really wrong. We don’t want to do
real computing here. These save the output to a file named
ngrams2, which you might want to change between examples:
$ cd hpc-examples
$ python3 ngrams/count.py /scratch/shareddata/teaching/gutenberg-fiction/Gutenberg-Fiction-first100.zip -o ngrams2 -n 2
Now we do the same, but with srun to run on the cluster:
## character ngrams
$ srun python3 ngrams/count.py /scratch/shareddata/teaching/gutenberg-fiction/Gutenberg-Fiction-first100.zip -o ngrams2 -n 2

## word ngrams
$ srun python3 ngrams/count.py /scratch/shareddata/teaching/gutenberg-fiction/Gutenberg-Fiction-first100.zip -o ngrams2 -n 2 --words
If we compute word-ngrams for the 1000-book dataset, we see that we
run out of memory. Thus, we try again with the --mem=5G option
to see that it then works.
$ srun python3 ngrams/count.py /scratch/shareddata/teaching/gutenberg-fiction/Gutenberg-Fiction-first1000.zip --words -o ngrams2 -n 2
srun: slurm_job_submit: Automatically setting partition to: batch-hsw,batch-bdw,batch-csl,batch-skl,batch-milan
srun: job 5766825 queued and waiting for resources
srun: job 5766825 has been allocated resources
Found 1000 files in /scratch/shareddata/teaching/gutenberg-fiction/Gutenberg-Fiction-first1000.zip
slurmstepd: error: Detected 1 oom_kill event in StepId=5766825.0. Some of the step tasks have been OOM Killed.

$ srun --mem=5G --time=0-1 python3 ngrams/count.py /scratch/shareddata/teaching/gutenberg-fiction/Gutenberg-Fiction-first1000.zip --words -o ngrams2 -n 2
Part of a series: pi:
Interactive-3: Time scaling
The program hpc-examples/slurm/pi.py
calculates pi using a simple stochastic algorithm. The program takes
one positional argument: the number of trials.
The time program allows you to time any program, e.g. you can
time python x.py to print the amount of time it takes.
Run the program, timing it with
time, a few times, increasing the number of trials, until it takes about 10 seconds:time python hpc-examples/slurm/pi.py 500, then 5000, then 50000, and so on.Add
srunin front (srun python ...). Use theseff JOBIDcommand to see how much time the program took to run. (If you’d like to use thetimecommand, you can runsrun --mem=MEM --time=TIME time python hpc-examples/slurm/pi.py ITERS)Look at the job history using
slurm history- can you see how much time each process used? What’s the relation between TotalCPUTime and WallTime?
Solution
$ time python3 slurm/pi.py 5000
Calculating pi via 5000 stochastic trials
{"pi_estimate": 3.1384, "iterations": 5000, "successes": 3923}

real   0m0.095s
user   0m0.082s
sys    0m0.014s
$ time python3 slurm/pi.py 50000
Calculating pi via 50000 stochastic trials
{"pi_estimate": 3.13464, "iterations": 50000, "successes": 39183}

real   0m0.154s
user   0m0.134s
sys    0m0.020s
$ time python3 slurm/pi.py 500000
Calculating pi via 500000 stochastic trials
{"pi_estimate": 3.141776, "iterations": 500000, "successes": 392722}

real   0m0.792s
user   0m0.766s
sys    0m0.023s
$ time python3 slurm/pi.py 5000000
Calculating pi via 5000000 stochastic trials
{"pi_estimate": 3.1424752, "iterations": 5000000, "successes": 3928094}

real   0m6.287s
user   0m6.262s
sys    0m0.026s
$ srun python3 slurm/pi.py 5000000
srun: job 19201873 queued and waiting for resources
srun: job 19201873 has been allocated resources
Calculating pi via 5000000 stochastic trials
{"pi_estimate": 3.1424752, "iterations": 5000000, "successes": 3928094}
$ srun python3 slurm/pi.py 50000000
srun: job 19201880 queued and waiting for resources
srun: job 19201880 has been allocated resources
Calculating pi via 50000000 stochastic trials
{"pi_estimate": 3.14153752, "iterations": 50000000, "successes": 39269219}
$ srun python3 slurm/pi.py 500000000
srun: job 19201910 queued and waiting for resources
srun: job 19201910 has been allocated resources
Calculating pi via 500000000 stochastic trials
{"pi_estimate": 3.14152692, "iterations": 500000000, "successes": 392690865}
$ seff 19201873
Job ID: 19201873
Cluster: triton
User/Group: darstr1/darstr1
State: COMPLETED (exit code 0)
Cores: 1
CPU Utilized: 00:00:04
CPU Efficiency: 100.00% of 00:00:04 core-walltime
Job Wall-clock time: 00:00:04
Memory Utilized: 1.21 MB
Memory Efficiency: 0.24% of 500.00 MB
$ seff 19201880
...
CPU Utilized: 00:00:44
CPU Efficiency: 97.78% of 00:00:45 core-walltime
Job Wall-clock time: 00:00:45
...
$ seff 19201910
...
CPU Utilized: 00:07:51
CPU Efficiency: 99.58% of 00:07:53 core-walltime
Job Wall-clock time: 00:07:53
...
each process should be visible as a separate step indexed from 0. For larger iterations, TotalCpuTime should be similar to WallTime, Since TotalCpuTime shows amount of time Cpus were at full utilization, times the number of Cpus. Note that TotalCPUTime has precision of milliseconds, whereas WallTime has precision of seconds.
JobID         JobName              Start            ReqMem  MaxRSS TotalCPUTime    WallTime Tasks CPU Ns Exit State Nodes
19201873      python3              06-06 23:18:21     500M       -    00:04.044    00:00:04  none   1 1   0:0 COMP  csl48
  └─ extern   *                    06-06 23:18:21               0M    00:00.001    00:00:04     1   1 1   0:0 COMP  csl48
  └─ 0        python3              06-06 23:18:21               1M    00:04.043    00:00:04     1   1 1   0:0 COMP  csl48
19201880      python3              06-06 23:18:35     500M       -    00:44.417    00:00:45  none   1 1   0:0 COMP  csl48
  └─ extern   *                    06-06 23:18:35               1M    00:00.001    00:00:45     1   1 1   0:0 COMP  csl48
  └─ 0        python3              06-06 23:18:35               1M    00:44.415    00:00:45     1   1 1   0:0 COMP  csl48
19201910      python3              06-06 23:19:25     500M       -    07:51.107    00:07:53  none   1 1   0:0 COMP  csl48
  └─ extern   *                    06-06 23:19:25               1M    00:00.001    00:07:53     1   1 1   0:0 COMP  csl48
  └─ 0        python3              06-06 23:19:25              10M    07:51.106    00:07:53     1   1 1   0:0 COMP  csl48
Interactive-4: Info commands
Run squeue -a to see what is running, and then run slurm job
JOBID (or scontrol show job JOBID) on some running job - does
anything look interesting?
Solution
There’s possibly some interesting things here, if you can get it out of all the rest:
$ slurm job 19203764
JobId=19203764 JobName=python3
UserId=darstr1(1300204) GroupId=darstr1(1300204) MCS_label=N/A
Priority=630255 Nice=0 Account=aalto_users QOS=normal
JobState=COMPLETED Reason=None Dependency=(null)
Requeue=1 Restarts=0 BatchFlag=0 Reboot=0 ExitCode=0:0
RunTime=00:00:06 TimeLimit=00:15:00 TimeMin=N/A
SubmitTime=2023-06-07T00:10:23 EligibleTime=2023-06-07T00:10:23
AccrueTime=2023-06-07T00:10:23
StartTime=2023-06-07T00:10:25 EndTime=2023-06-07T00:10:31 Deadline=N/A
SuspendTime=None SecsPreSuspend=0 LastSchedEval=2023-06-07T00:10:25 Scheduler=Main
Partition=batch-csl AllocNode:Sid=triton:4896
ReqNodeList=(null) ExcNodeList=(null)
NodeList=csl48
BatchHost=csl48
NumNodes=1 NumCPUs=1 NumTasks=1 CPUs/Task=1 ReqB:S:C:T=0:0:*:*
TRES=cpu=1,mem=500M,energy=2391,node=1,billing=1
Socks/Node=* NtasksPerN:B:S:C=0:0:*:* CoreSpec=*
MinCPUsNode=1 MinMemoryCPU=500M MinTmpDiskNode=0
Features=(null) DelayBoot=00:00:00
OverSubscribe=OK Contiguous=0 Licenses=(null) Network=(null)
Command=python3
WorkDir=/home/darstr1/git/hpc-examples
Power=
Interactive-5: Showing node information
Run scontrol show node csl1 What is this? (csl1 is the
name of a node on Triton - if you are not on Triton, look at the
sinfo -N command and try one of those names).
Interactive-6: Why not script srun
Some people are clever and use shell scripting to run
srunmany times in a loop (using&to background it so that they all run at the same time). Can you list some advantages and disadvantages to this?
Solution
In does work, but it’s fragile: if the login node dies, everything
gets lost. It’s actually more work than doing it properly
(Array jobs: embarassingly parallel execution). And Slurm knows all array jobs are the same, so
it takes less resources to manage them - if someone scripts too
many sruns, it can actually block other jobs from running
when they could otherwise.
What’s next?
In the next tutorial on serial batch jobs, you will learn how to put the above-mentioned commands in a script, namely a batch script (a.k.a submission script) that allows for a multitude of jobs to run unattended.